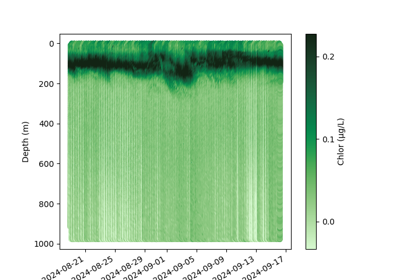
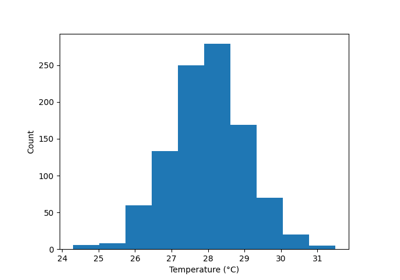
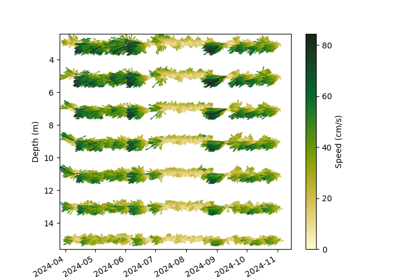
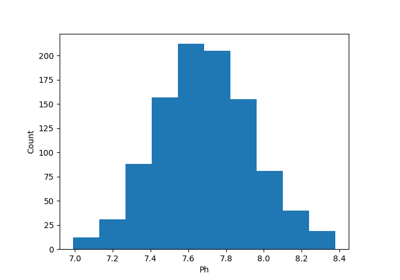
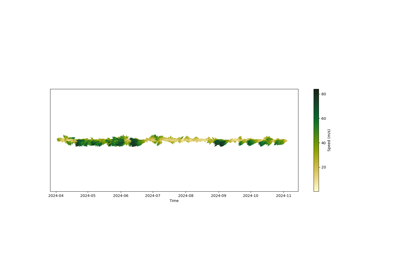
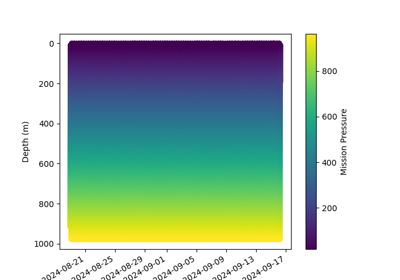
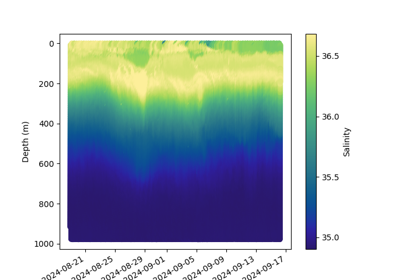
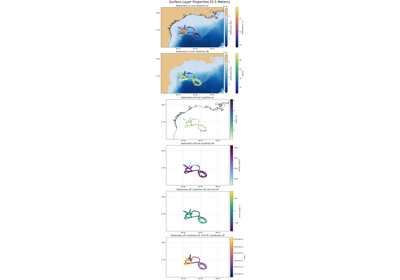
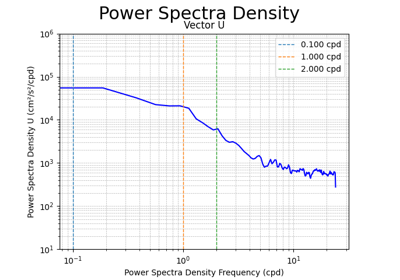
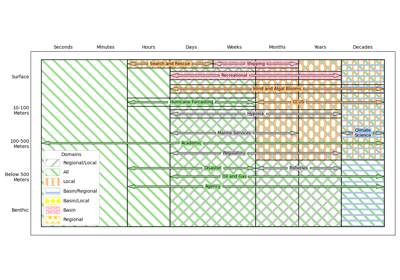
Examples# Some examples: Hovmoller Example Hovmoller Example Data From Netcdf Example Data From Netcdf Example Simple map plot Simple map plot Tricontourf Example Tricontourf Example Histogram Example Histogram Example Scatter Plot Example Scatter Plot Example Quiver 2D Example Quiver 2D Example Custom Variable Example Custom Variable Example Quiver 1D Example Quiver 1D Example How to import gerg_plotting How to import gerg_plotting TS Examples TS Examples Data From Netcdf Example with Custom Variables Data From Netcdf Example with Custom Variables Set vmin and vmax for Plot Set vmin and vmax for Plot Changing axes and figure visualization Changing axes and figure visualization Animation Example Animation Example Data Slicing Examples Data Slicing Examples Data Object Example Data Object Example Subplots Example Subplots Example Power Spectra Example Power Spectra Example Coverage Plot Example Coverage Plot Example Gallery generated by Sphinx-Gallery