Note
Go to the end to download the full example code.
Data Slicing Examples#
This example demonstrates different ways to slice data in gerg_plotting
Load the sample data#
from gerg_plotting import data_from_netcdf,ScatterPlot,Variable

data = data_from_netcdf('example_data/sample_glider_data.nc'
                        ,interp_glider=True,bounds_padding=1.5)

# Show the default unsliced data
plotter_data = ScatterPlot(data)
plotter_data.hovmoller('temperature')
plotter_data.show()

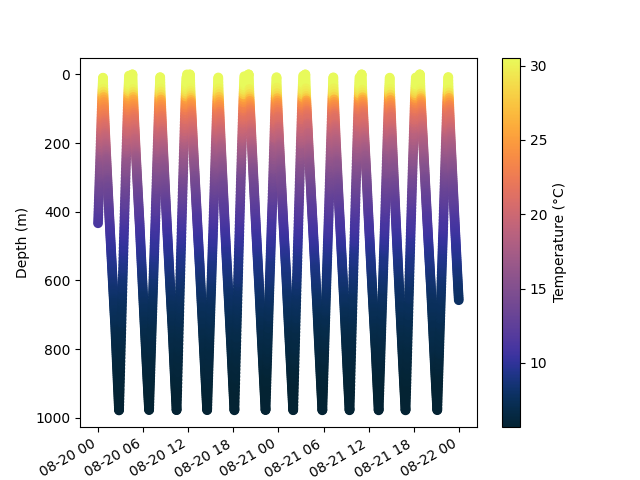
Time-based slicing#
Get the dates and define time bounds
import numpy as np

dates = data.time.values
start_date = np.datetime64('2024-08-20')
end_date = np.datetime64('2024-08-22')

# Slice the data based on the dates
data_time_sliced = data[(dates >= start_date) & (dates <= end_date)]
plotter_data_time_sliced = ScatterPlot(data_time_sliced)
plotter_data_time_sliced.hovmoller('temperature')
plotter_data_time_sliced.show()
Numeric variable slicing#
data_temp_sliced = data[(data.temperature.values > 20)]
plotter_data_temp_sliced = ScatterPlot(data_temp_sliced)
plotter_data_temp_sliced.hovmoller('temperature')
plotter_data_temp_sliced.show()

Categorical variable slicing#
import random

def generate_sample_dataset(n):
    categories = ["small", "medium", "large"]
    weights = [0.01, 0.09, 0.9]  # Very skewed distribution
    return random.choices(categories, weights=weights, k=n)

n = len(data.temperature.values)
sample_data = generate_sample_dataset(n)
example_var = Variable(name="string_var",values=sample_data)
data.add_custom_variable(example_var)

data_string_sliced = data[(data.string_var.values == 'small')]
plotter_data_string_sliced = ScatterPlot(data_string_sliced)
plotter_data_string_sliced.hovmoller('temperature')
plotter_data_string_sliced.show()

Total running time of the script: (0 minutes 1.301 seconds)