Note
Go to the end to download the full example code.
TS Examples#
Examples of how to plot TS diagrams using the ScatterPlot class.
Read in the example data#
from gerg_plotting import ScatterPlot, data_from_csv

# Let's read in the example data
data = data_from_csv('example_data/sample_glider_data.csv')
Initialize the scatter plot#
scatter = ScatterPlot(data)
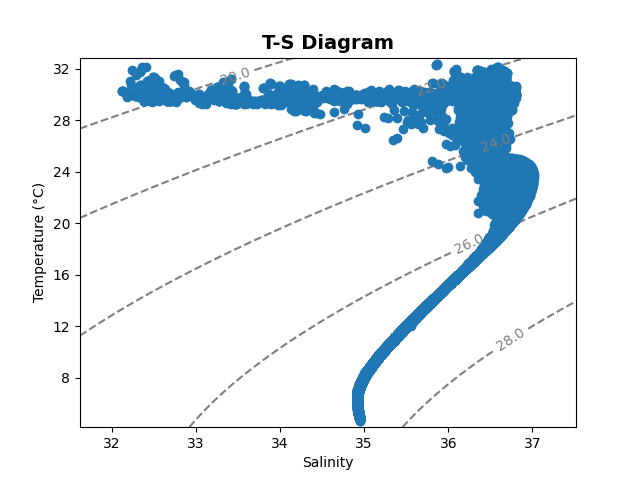
Plot just the TS diagram # ———————————————————————–
scatter.TS()
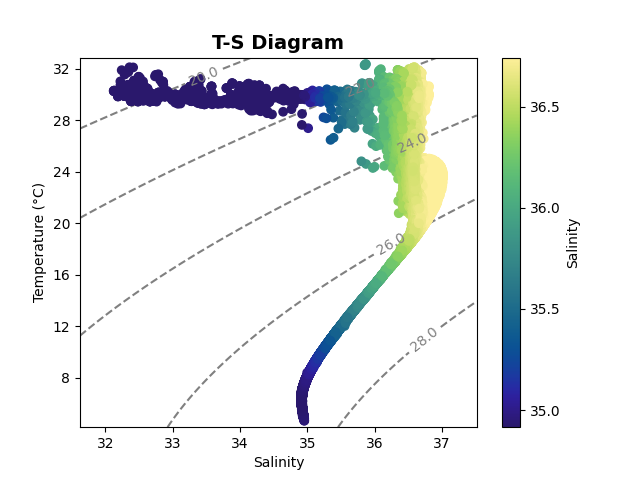
Plot the TS diagram with a color variable#
scatter.TS(color_var='salinity')
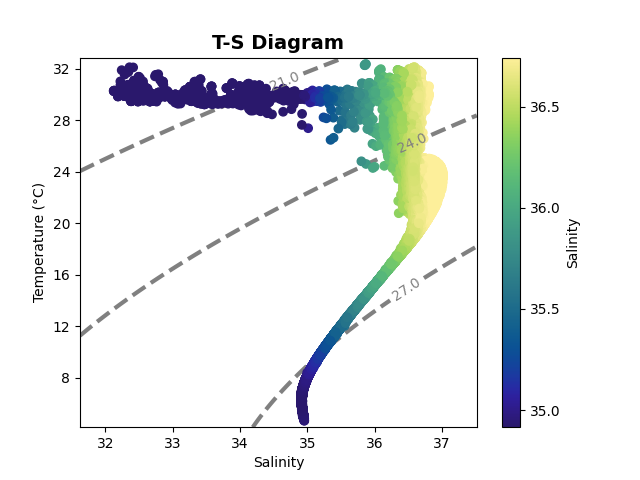
Plot the TS diagram with contour kwargs#
scatter.TS(color_var='salinity',contour_kwargs={'levels':3,'linewidths':3})
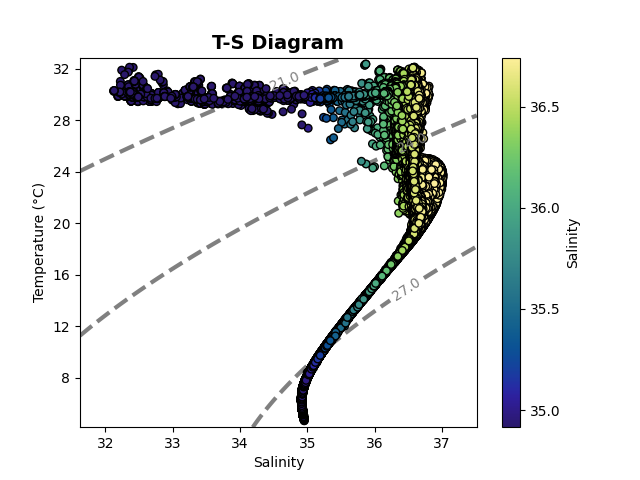
Plot the TS diagram with contour kwargs and scatter kwargs#
contour_kws={'levels':3,'linewidths':3}
scatter_kws={'s':30,'edgecolors':'black'}
scatter.TS(color_var='salinity',contour_kwargs=contour_kws,scatter_kwargs=scatter_kws)
Total running time of the script: (0 minutes 3.353 seconds)