Note
Go to the end to download the full example code.
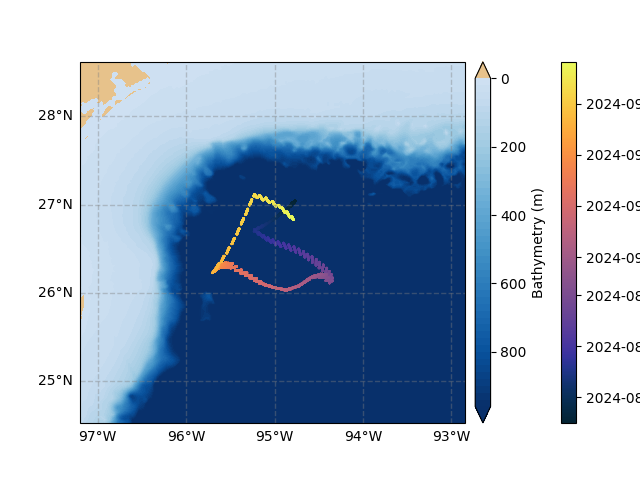
Simple map plot#
Example of a simple map plot.
Downloading seafloor_data.nc for future use. This may take a few minutes...
seafloor_data.nc downloaded successfully to /home/docs/checkouts/readthedocs.org/user_builds/gerg-plotting/envs/latest/lib/python3.12/site-packages/gerg_plotting/seafloor_data/seafloor_data.nc.
Downloading gom_srtm30_plus.txt for future use. This may take a few minutes...
gom_srtm30_plus.txt downloaded successfully to /home/docs/checkouts/readthedocs.org/user_builds/gerg-plotting/envs/latest/lib/python3.12/site-packages/gerg_plotting/seafloor_data/gom_srtm30_plus.txt.
from gerg_plotting import data_from_netcdf,MapPlot

data = data_from_netcdf('example_data/sample_glider_data.nc',interp_glider=True,bounds_padding=1.5)

plotter = MapPlot(data)
plotter.scatter('time',show_bathy=True,show_coastlines=False)

plotter.save('example_plots/map_simple.png',bbox_inches='tight')
Total running time of the script: (0 minutes 19.846 seconds)