Note
Go to the end to download the full example code.
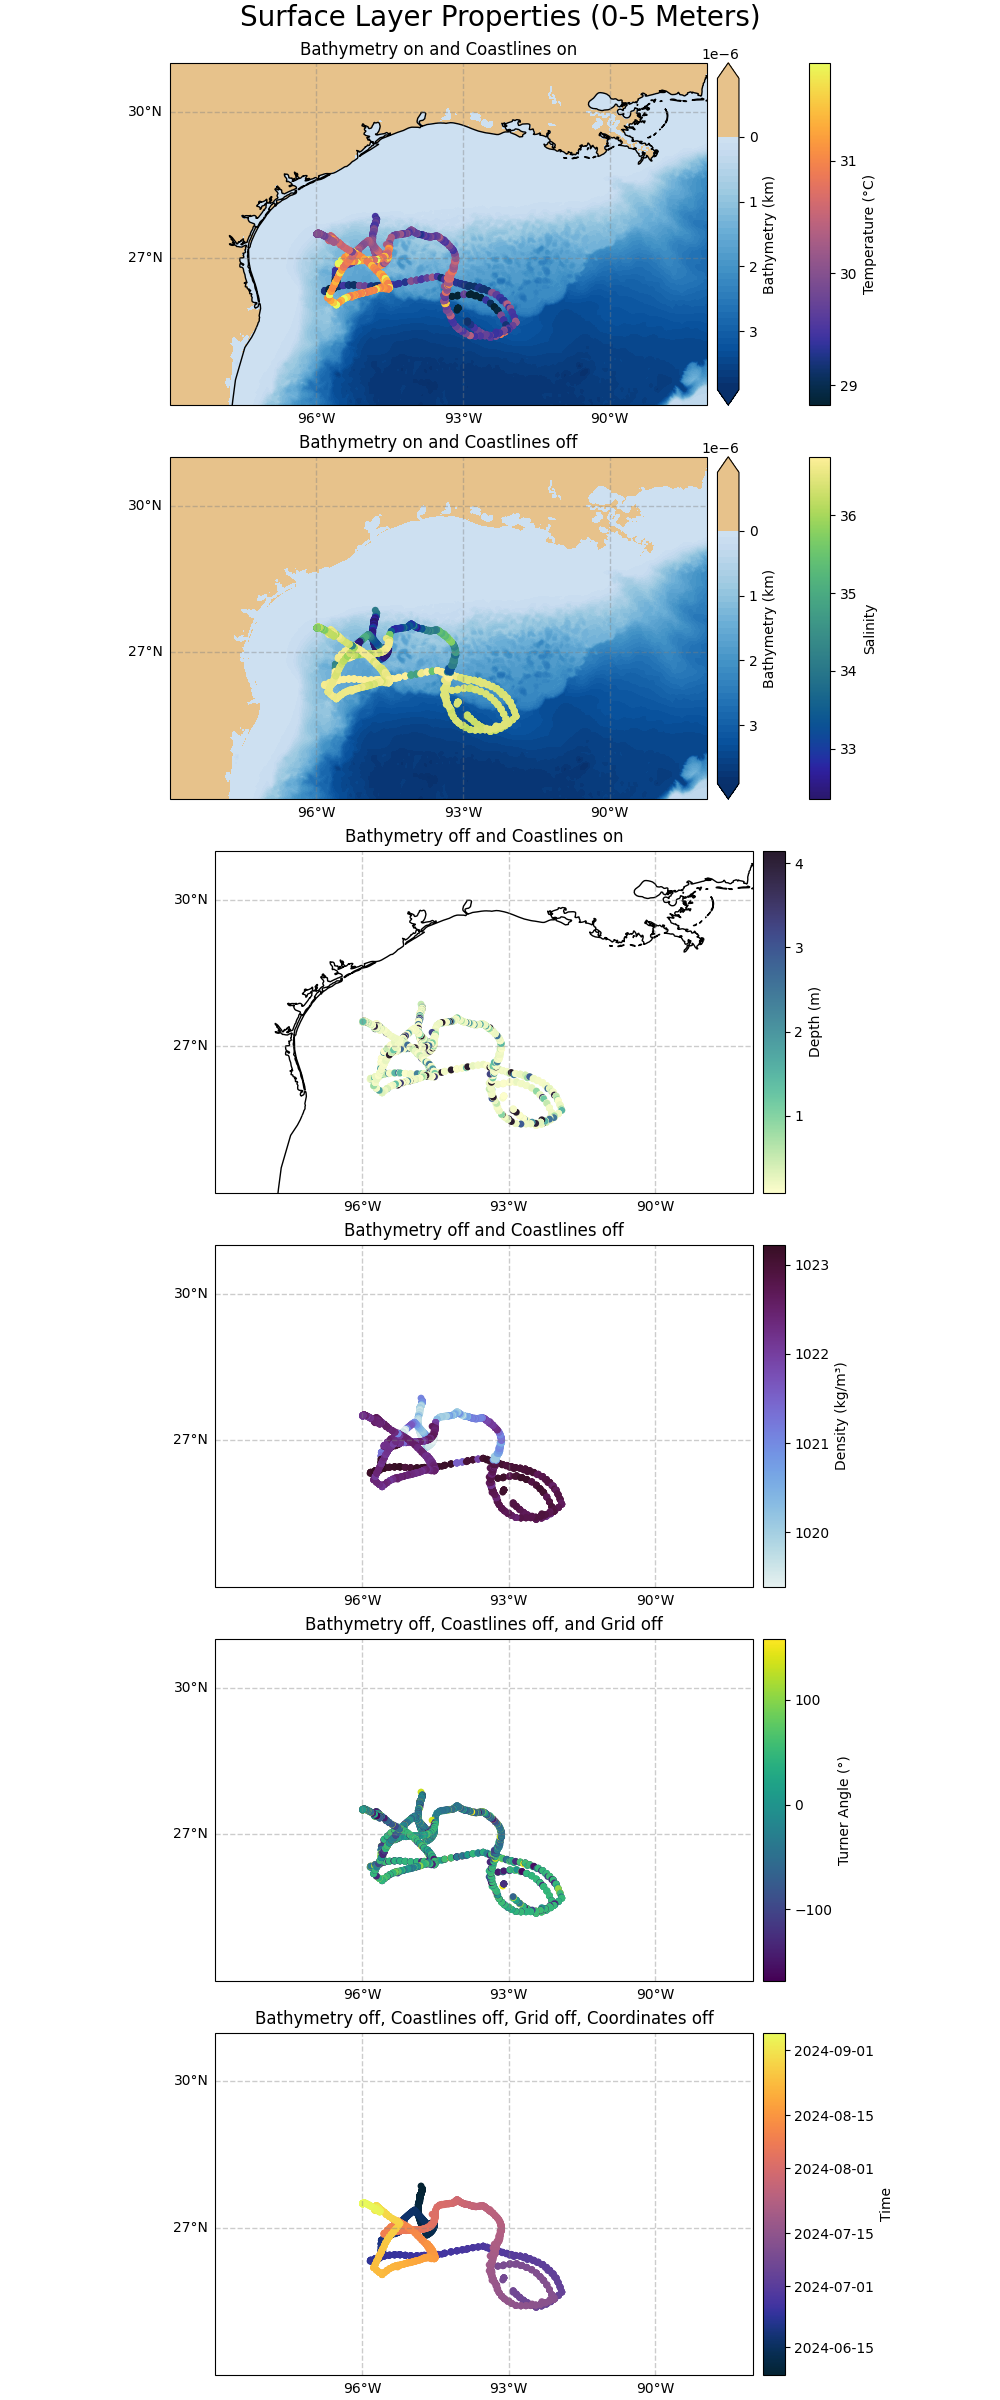
Subplots Example#
Example of how to create subplots.
/home/docs/checkouts/readthedocs.org/user_builds/gerg-plotting/envs/latest/lib/python3.12/site-packages/cartopy/io/__init__.py:241: DownloadWarning: Downloading: https://naturalearth.s3.amazonaws.com/10m_physical/ne_10m_coastline.zip
  warnings.warn(f'Downloading: {url}', DownloadWarning)
from gerg_plotting import MapPlot, Bounds,Variable, data_from_df
import matplotlib.pyplot as plt
import cartopy.crs as ccrs
import pandas as pd

# Define bounds
bounds = Bounds(lat_min = 24,lat_max = 31,lon_min = -99, lon_max = -88, depth_top=-1, depth_bottom=500, vertical_scalar=1/1000,vertical_units='km')
# Let's read in the example data
df = pd.read_csv('example_data/sample_glider_data.csv')
# Select the top 5 meters of the data
df = df[df.pressure<5]
# Init the data object with the bounds
data = data_from_df(df,bounds=bounds)
# Add a custom variable
data.add_custom_variable(variable=Variable(values=df['Turner_angle'],name='Turner_angle',label='Turner Angle (°)'))

# Init subplots
fig,ax = plt.subplots(figsize=(10,24),nrows=6,subplot_kw={'projection': ccrs.PlateCarree()},layout='constrained')
pointsize = 25
# Init MapPlot object
plotter = MapPlot(data=data,grid_spacing=3)
# Generate Scatter plots on one figure
plotter.scatter(fig=fig,ax=ax[0],var='temperature',show_bathy=True,pointsize=pointsize)
plotter.ax.set_title('Bathymetry on and Coastlines on')
plotter.scatter(fig=fig,ax=ax[1],var='salinity',show_bathy=True,show_coastlines=False,pointsize=pointsize)
plotter.ax.set_title('Bathymetry on and Coastlines off')
plotter.scatter(fig=fig,ax=ax[2],var='depth',show_bathy=False,show_coastlines=True,pointsize=pointsize)
plotter.ax.set_title('Bathymetry off and Coastlines on')
plotter.scatter(fig=fig,ax=ax[3],var='density',show_bathy=False,show_coastlines=False,pointsize=pointsize)
plotter.ax.set_title('Bathymetry off and Coastlines off')
plotter.scatter(fig=fig,ax=ax[4],var='Turner_angle',show_bathy=False,show_coastlines=False,grid=False,pointsize=pointsize)
plotter.ax.set_title('Bathymetry off, Coastlines off, and Grid off')
plotter.scatter(fig=fig,ax=ax[5],var='time',show_bathy=False,show_coastlines=False,grid=False,show_coords=False,pointsize=pointsize)
plotter.ax.set_title('Bathymetry off, Coastlines off, Grid off, Coordinates off')

# Add a title
plotter.fig.suptitle('Surface Layer Properties (0-5 Meters)',fontsize = 20)
# If you want to show the plot
# plotter.show()
plotter.save('example_plots/map_subplots_example.png',dpi=500,bbox_inches='tight')
Total running time of the script: (0 minutes 4.921 seconds)