Note
Go to the end to download the full example code.
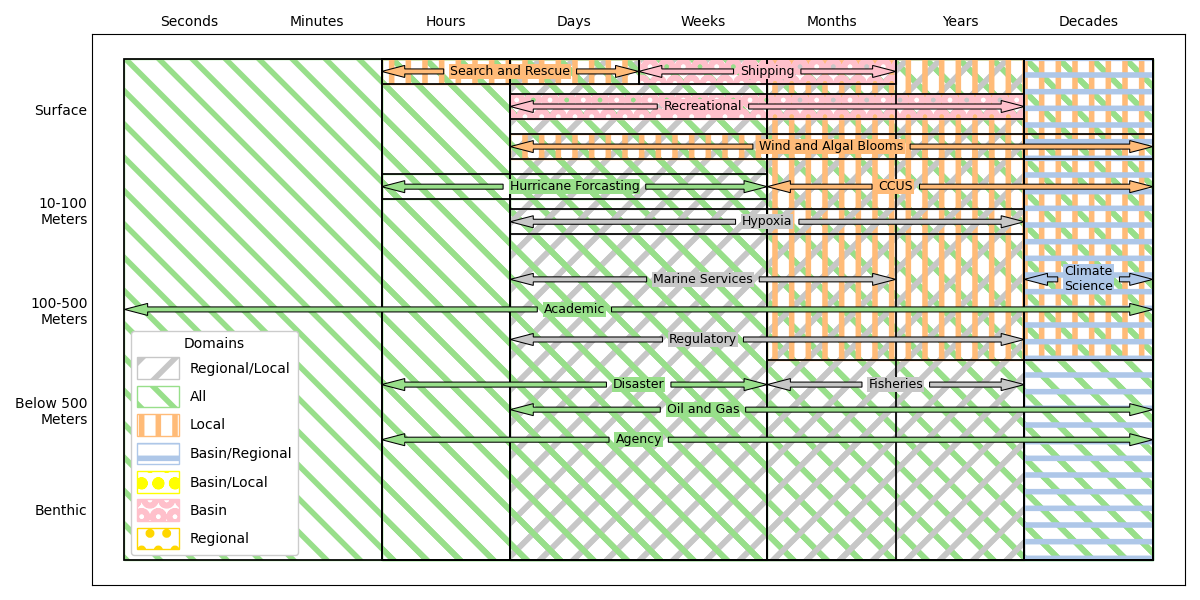
Coverage Plot Example#
How to create a coverage plot.
from gerg_plotting import CoveragePlot
from gerg_plotting.tools.tools import custom_legend_handles

import matplotlib.pyplot as plt

cmap = plt.get_cmap('tab20')
domains = ['Regional_Local', 'All', 'Local', 'Basin_Regional', 'Basin_Local', 'Basin', 'Regional']
colors_light = [cmap(15),cmap(5),cmap(3),cmap(1),'yellow','pink','gold']

colors = colors_light
domain_colors = {key:value for key,value in zip(domains,colors)}

hatch_styles = ['/', '\\', '|', '-', 'o', 'O', '.', '*',
                '//', '\\\\', '||', '--', '++', 'xx', 'oo', 'OO', '..', '**', '/o',
                '\\|', '|*', '-\\', '+o', 'x*', 'o-', 'O|', 'O.', '*-']

domain_hatches = {key:value for key,value in zip(domains,hatch_styles)}
# Define the x and y labels
xlabels = ['Seconds','Minutes','Hours','Days','Weeks','Months','Years','Decades']
ylabels = ['Surface','10-100\nMeters','100-500\nMeters','Below 500\nMeters','Benthic']

# Define the default plotting parameters
plotting_kwargs = {'arrow_facecolor':'hatch_color','body_color':'none','label_fontsize':9,'label_background_pad':0.75,
                'label_background_color':'hatch_color','arrow_linewidth':0.75,'hatch_linewidth':4,'outline_linewidth':1.25,
                'show_arrows':False}

# Init the coverage plotter
plotter = CoveragePlot(figsize=(12,6),xlabels=xlabels,ylabels=ylabels,plotting_kwargs=plotting_kwargs)
# All Depths
plotter.add_coverage(['Hours','Decades'],['Surface','Benthic'],label='Agency',label_position=(4,3.3),hatch_color=domain_colors['All'],hatch=domain_hatches['All'])
plotter.add_coverage(['Seconds','Decades'],['Surface','Benthic'],label='Academic',label_position=(3.5,2),hatch_color=domain_colors['All'],hatch=domain_hatches['All'])
plotter.add_coverage(['Days','Months'],['Surface','Benthic'],label='Marine Services',label_position=(4.5,1.7),hatch_color=domain_colors['Regional_Local'],hatch=domain_hatches['Regional_Local'])
plotter.add_coverage(['Days','Years'],['Surface','Benthic'],label='Regulatory',label_position=(4.5,2.3),hatch_color=domain_colors['Regional_Local'],hatch=domain_hatches['Regional_Local'])
plotter.add_coverage(['Days','Decades'],['Surface','Benthic'],label='Oil and Gas',label_position=(4.5,3),hatch_color=domain_colors['All'],hatch=domain_hatches['All'])
plotter.add_coverage(['Months','Years'],['Surface','Benthic'],label='Fisheries',label_position=(6,2.75),hatch_color=domain_colors['Regional_Local'],hatch=domain_hatches['Regional_Local'])
plotter.add_coverage(['Hours','Weeks'],['Surface','Benthic'],label='Disaster',label_position=(4,2.75),hatch_color=domain_colors['All'],hatch=domain_hatches['All'])
# Surface
plotter.add_coverage(['Hours','Days'],[-0.5,-0.5],label='Search and Rescue',hatch_color=domain_colors['Local'],hatch=domain_hatches['Local'])
plotter.add_coverage(['Days','Decades'],[0.25,0.25],label='Wind and Algal Blooms',hatch_color=domain_colors['Local'],hatch=domain_hatches['Local'])
# 10-100m
plotter.add_coverage(['Months','Decades'],['Surface','100-500 Meters'],label='CCUS',label_position=(6,0.775),hatch_color=domain_colors['Local'],hatch=domain_hatches['Local'])
plotter.add_coverage(['Hours','Weeks'],[0.65,0.65],label='Hurricane Forcasting',hatch_color=domain_colors['All'],hatch=domain_hatches['All'])
plotter.add_coverage(['Days','Years'],[1,1],label='Hypoxia',hatch_color=domain_colors['Regional_Local'],hatch=domain_hatches['Regional_Local'])

plotter.add_coverage('Decades',['Surface','Benthic'],label='Climate\nScience',label_position=(7.5,1.7),hatch_color=domain_colors['Basin_Regional'],hatch=domain_hatches['Basin_Regional'])
plotter.add_coverage(['Weeks','Months'],[-0.5,-0.5],label='Shipping',hatch_color=domain_colors['Basin'],hatch=domain_hatches['Basin'])
plotter.add_coverage(['Days','Years'],[-0.15,-0.15],label='Recreational',label_position=(4.5,-0.025),hatch_color=domain_colors['Basin'],hatch=domain_hatches['Basin'])

plotter.plot(show_grid=False)

handles = custom_legend_handles(domain_colors.keys(),domain_colors.values(),hatches=domain_hatches.values(),color_hatch_not_background=True)
plotter.fig.legend(handles=handles,bbox_to_anchor=(0.254, 0.46),framealpha=1,title='Domains',handleheight=2, handlelength=3)

plotter.fig.tight_layout()

plotter.save('example_plots/coverage_plot_example.png',dpi=600,bbox_inches='tight')
Total running time of the script: (0 minutes 1.555 seconds)