Note
Go to the end to download the full example code.
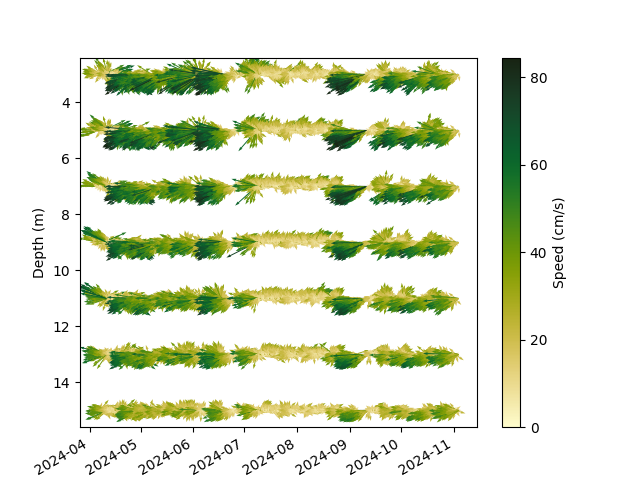
Quiver 2D Example#
Example of a 2D quiver plot.
from gerg_plotting import ScatterPlot, data_from_csv

data = data_from_csv('example_data/sample_tabs_data.csv')

data.calculate_speed()

data.speed.units = 'cm/s'

scatter = ScatterPlot(data)
scatter.quiver2d(x='time',y='depth',quiver_scale=800)
scatter.ax.invert_yaxis()
scatter.save('example_plots/quiver_2d_example.png',bbox_inches='tight')
# If you want to show the plot
# scatter.show()
Total running time of the script: (0 minutes 3.242 seconds)