Note
Go to the end to download the full example code.
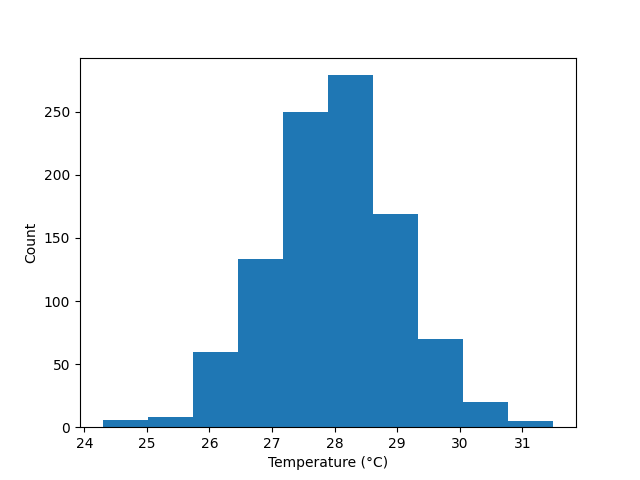
Histogram Example#
Example of a histogram plotter.
from gerg_plotting import Histogram, Data
import numpy as np

# Initalize the data object with some sample data
data = Data(temperature=np.random.normal(28,size=1000))

hist = Histogram(data)  # Assign the histogram plotter to a variable
hist.plot(var='temperature')

hist.save('example_plots/histogram_example.png',bbox_inches='tight')
Total running time of the script: (0 minutes 0.098 seconds)